MKDA Chi-Squared and large-scale association tests
How to perform large-scale association tests using MKDA Chi-Squared Meta-Analysis, with a Social Processing example
The Reverse Inference Problem
A common goal of neuroimaging meta-analysis, is to pool a set of studies that invoke common psychological constructs to identify where brain activity is consistently activated.
Although this is a useful approach, there is a significant inferential challenge-- namely, determining how specific the relationship between activity in a given region and the cognitive state invoked by the target task. Ideally, we would like to infer the probability of a mental state given activity in a given region. However, this is exceedingly difficult due to the well-established problem of reverse inference (Poldrack, 2011).
Even if we establish that a given task (e.g. working memory) activates a region 100% of the time (e.g. lateral prefrontal cortex), this observation only establishes that working memory engagement is a sufficient condition for LPFC activity, but not that LPFC activity indicates working memory engagement (Poldrack & Yarkoni, 2015). In practice, we know that brain regions are activated by a variety of cognitive processes, and that certain regions of the brain- such as the insula, lateral PFC and medial frontal cingulate cotex (MFCC)- have a high base rate of activation, making it difficult to establish specificity. Using the Neurosynth database (15,000+ studies), we can map the probability of activation of all voxels. Across this large and diverse dataset, certain voxels in MFCC and insula are activate in as many as 20% of studies.
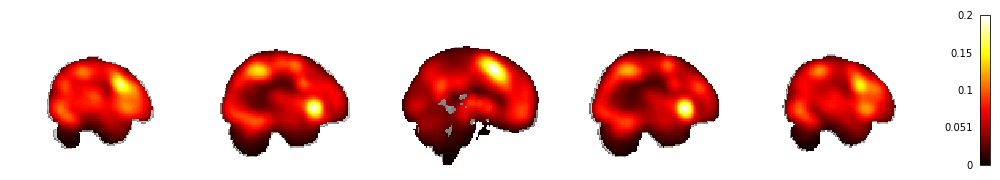 Probability of Activity for all Voxels across the Neurosynth Dataset
The reverse inference problem is a challenge even for rigorous, high-quality meta-analyses. For example, a recent meta-analysis of RDoC social constructs across 864 fMRI contrasts, Pintos Lobo et al., (2022) found converging activation across a variety of regions for "All Social Processing Tasks", including mPFC, ACC, PCC, TPJ, bilateral insula, amygdala, fusiform gyrus, precuneus, and thalamus. However, some of the regions have a high base rate of activation, making it difficult to know how strongly associated their activity is with social processing.

Fig 5a (condensed) from Pintos Lobo et al., (2022). Convergent Activation Patterns Across all social processing tasks (864 contrasts, 1,109 total annotations).
Although reverse inference poses a serious challenge, there are certain questions we can ask using large-scale meta-analytic databases that can help. Specifically: does activity occur more consistently for studies that elicit by the mental construct of interest (in this case, social processing) than studies that do not elicit that construct Large-scale meta-analytic datasets can serve as a useful reference, as they consists of tens of thousands of diverse neuroimaging studies automatically sampled from the literature.
MKDA Chi-Squared
We can answer this question using a Multilevel kernel density (MKDA) analysis - Chi-square analysis, originally introduced in Wager et al.,. For every voxel, we test if a greater proportion of studies in our meta-analysis activate a given voxel than in a large set of studies that we did not select for our inclusion criteria.
Conceptually, this tests if there's evidence of a population level association between the task or psychological construct in our meta-analysis and brain activation (for every voxel). It is equivalent to conducting a chi-squared test of independence for a 2-by-2 table of counts for each voxel, where the binary variables are foci occurrence in the meta-analysis of interest and foci occurrence in the reference set of unselected studies.
How to run MKDA Chi-Squared on Neurosynth Compose
Specification
Specifying an MKDA Chi-Square meta-analysis in Neurosynth is easy. Simply, select a target set of Analyses to include from your StudySet as you would for any other meta-analysis.
In Step 3 ("Create Meta-Analysis Specification") of your Project, select MKDAChi2 as the algorithm.

By default, the FDRCorrector is selected, which will perform cluster correction using False Detection Rate with an alpha of 0.05.
This is a fast algorithm, however, it is recommended to use FWECorrector (family-wise-error) with the montecarlo method for more accurate, publication-quality results.
Next, select the annotation inclusion column you want to use, as before (by default, the "included" column will be used).
Now, select a reference dataset from the dropdown list below. The Neurosynth dataset represents the latest release of the legacy Neurosynth dataset (version 7), released July, 2018. The Neurostore dataset represents the latest update of our continuously updating "live" dataset, spanning over 20,000 neuroimaging studies.
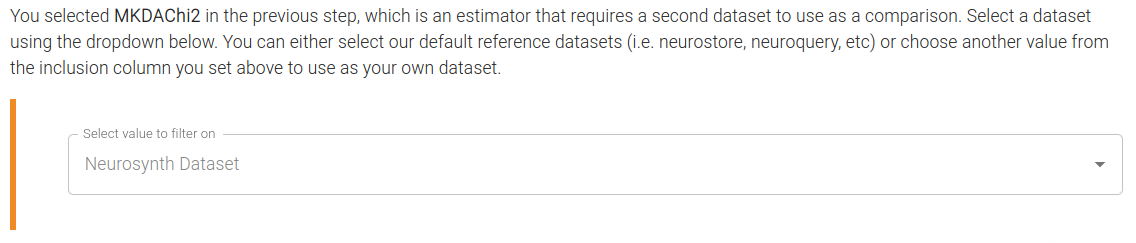
Now simply complete the rest of the meta-analysis specification wizard to finish.
Executing your analysis
As usual, you can execute your meta-analysis using Google Colab or on a local computational resource using Docker.
The MKDAChi2 algorithm takes between ~30s-2minutes to run. However, the FWECorrector with 5,000+ montecarlo iterations can take several hours to complete.
We recommend using a workstation or HPC and specifying --n-cores at run-time.
Interpreting results
The MKDA Chi-Squared Workflow outputs two key maps: uniformity and association test maps.
- Uniformity test map: z-scores from a one-way ANOVA testing whether the proportion of studies that report activation at a given voxel differs from the rate that would be expected if activations were uniformly distributed throughout gray matter.
The uniformity test map can be interpreted in roughly the same way as most standard whole-brain fMRI analysis: it displays the degree to which each voxel is consistently activated in studies that use a given term. For instance, for a meta-analysis of "emotion" high z-scores in the amygdala implies that studies that use the word emotion a lot tend to consistently report activation in the amygdala--at least, more consistently than one would expect if activation were uniformly distributed throughout gray matter.
- Association test map: z-scores from a two-way ANOVA testing for the presence of a non-zero association between term use and voxel activation.
The association test maps tell you whether activation in a region XXX occurs more consistently for studies in your meta-analytic sample m than for other studies in the reference dataset. In other words, a large positive z-score implies that studies in a meta-analysis are more likely to report XXX activation than studies whose abstracts don't include the word 'emotion'.
Note that association maps do not tell you what the probability of a given psychological concept or task is. High Z-scores do not imply that a certain region or voxel is selective for a given concept or task. Instead, it just means there is evidence that there is at least a non-zero difference between reference studies, and studies in the meta-analysis.
NiMARE outputs a variety of maps, including cluster-corrected and uncorrected versions of all maps.
See the documentation sections on Outputs of NIMARE and Monte Carlo multiple comparisons for more details.
Example: Pintos Lobo (2022) - All Social Processing Tasks
To demonstrate, we used Neurosynth-Compose to replicate the Pintos Lobo et al., (2022) meta-analysis for All Social Processing Tasks. For this example, we have already created a Project and StudySet with the coordinates used in this meta-analysis.
We then specified a MKDAChi2 Meta-Analysis with FWECorrector with the montecarlo method with 5,000 iterations.
Results
First, let's look at the FWE cluster corrected uniformity test map.
z_desc-uniformityMass_level-cluster_corr-FWE_method-montecarlo
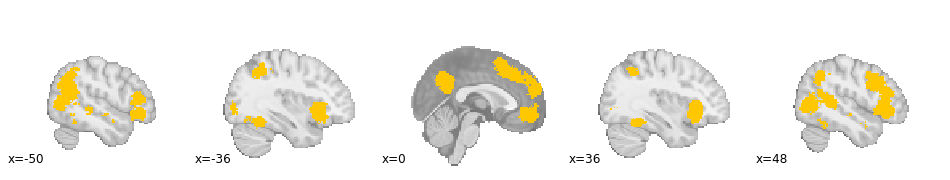
In this analysis, we replicate the findings of Pinto Lobos (2022), showing consistent activation for social processing across a variety of regions.
Next, let's look at the FWE cluster corrected association map:
z_desc-associationMass_level-cluster_corr-FWE_method-montecarlo
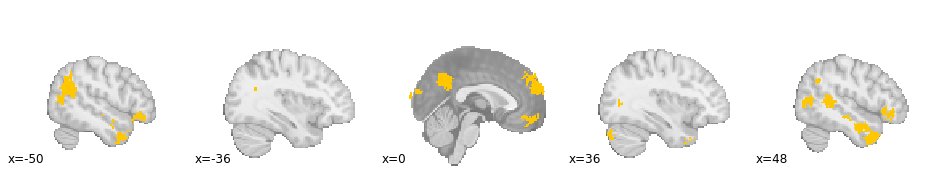
As before, regions which have been previously implicated with social processing, such as the tempo-parietal junction (TPJ), and dorso-medial and ventro-medial PFC are present, meaning that activity in these social processing studies report activity in these regions with greater frequency than other studies in the Neurosynth database.
However, certain regions which we know to have low specificity, such as the insula, medial frontal cingulate cortex (MFCC) and parts of dorso-lateral PFC, are absent, meaning that there is no evidence that social processing tasks report activity in these regions more frequently than other studies in the database.
This example demonstrates how MKDA Chi-Squared association analysis can help determine the specificity activity and tasks in a meta-analysis, even for high-quality manual meta-analyses.
Footnotes & Limitations
What happened to the "forward inference" and "reverse inference" maps?
We renamed the pre-generated forward and reverse inference maps; they're now referred to as the "uniformity test" and "association test" maps that we discuss here.
Although the method we used hasn't changed (MKDA Chi-Squared), the latter names more accurately capture what these maps actually mean. It was a mistake on our part to have used the forward and reverse inference labels; those labels should properly be reserved for posterior probability maps generated via a Bayesian estimation analysis, rather than for z-scores resulting from a frequentist inferential test of association. Probability maps are more difficult to interpret and use correctly, as they depend on the prior assumed by the researcher. Since setting an appropriate prior is highly non-trivial, these maps are disabled by default.
Using MKDA Chi Squared on manual meta-analyses
In this tutorial, we applied MKDA Chi-Squared to a manual meta-analysis. However, this is not a perfect comparison, as there are differences between the reference sample (Neurosynth), the high-quality manual annotations given as input. Studies in large-scale meta-analytic databases are automatically populated, meaning there are potential sampling biases. Most notably, studies in Neurosynth include all reported coordinates, not only "target" analyses/contrasts. Thus, it is possible that low-level task > no task contrasts are over-represented in this reference sample.
References & Further Reading
If you want to understand the nuances of what inferences you can and cannot make using these maps, we recommend reading Tal Yarkoni's blog posts on how these maps do not provide evidence that the dACC is select for pain: Post 1, Post 2, as well as a commentary by Tor Wager et al., 2016
Poldrack RA. Inferring mental states from neuroimaging data: from reverse inference to large-scale decoding. Neuron. 2011 Dec 8;72(5):692-7. doi: 10.1016/j.neuron.2011.11.001. PMID: 22153367; PMCID: PMC3240863.
Poldrack RA, Yarkoni T. From Brain Maps to Cognitive Ontologies: Informatics and the Search for Mental Structure. Annu Rev Psychol. 2016;67:587-612. doi: 10.1146/annurev-psych-122414-033729. Epub 2015 Sep 21. PMID: 26393866; PMCID: PMC4701616.