
I'm talking about 4 algorithms in NiMARE:
ALEALESubtractionMKDADensityMKDAChi2
The Problem with ALE
There's nothing wrong with Activation Likelihood Estimation (ALE). It is a well-established and widely validated method for coordinate-based meta-analysis.
But during the development of this platform, I have noticed that many users prefer to stick with ALE (especially ALESubtraction), and that is making some of our AWS instances sputter.
Specifically, an ALESubtraction analysis where the comparison group is the entire Neurostore database (which we currently allow).
I could just change the interface to disallow that (and we probably will), but I wanted to spill some ink about Multi-level Kernel Density Analysis (MKDA) and MKDIA Chi-squared (MKDAChi2) in case you aren't as familiar with them.
ALE vs MKDA: A Conceptual Comparison
ALE tells you where activations align between studies; MKDA tells you how consistently studies agree. The biggest difference between ALE and MKDA is the kernel. A kernel in this context is a function that draws a 3D numerical sphere around each reported coordinate. Whereas ALE's kernel is like a rolling hill (gaussian), MKDA's kernel is more like a mesa (binary).
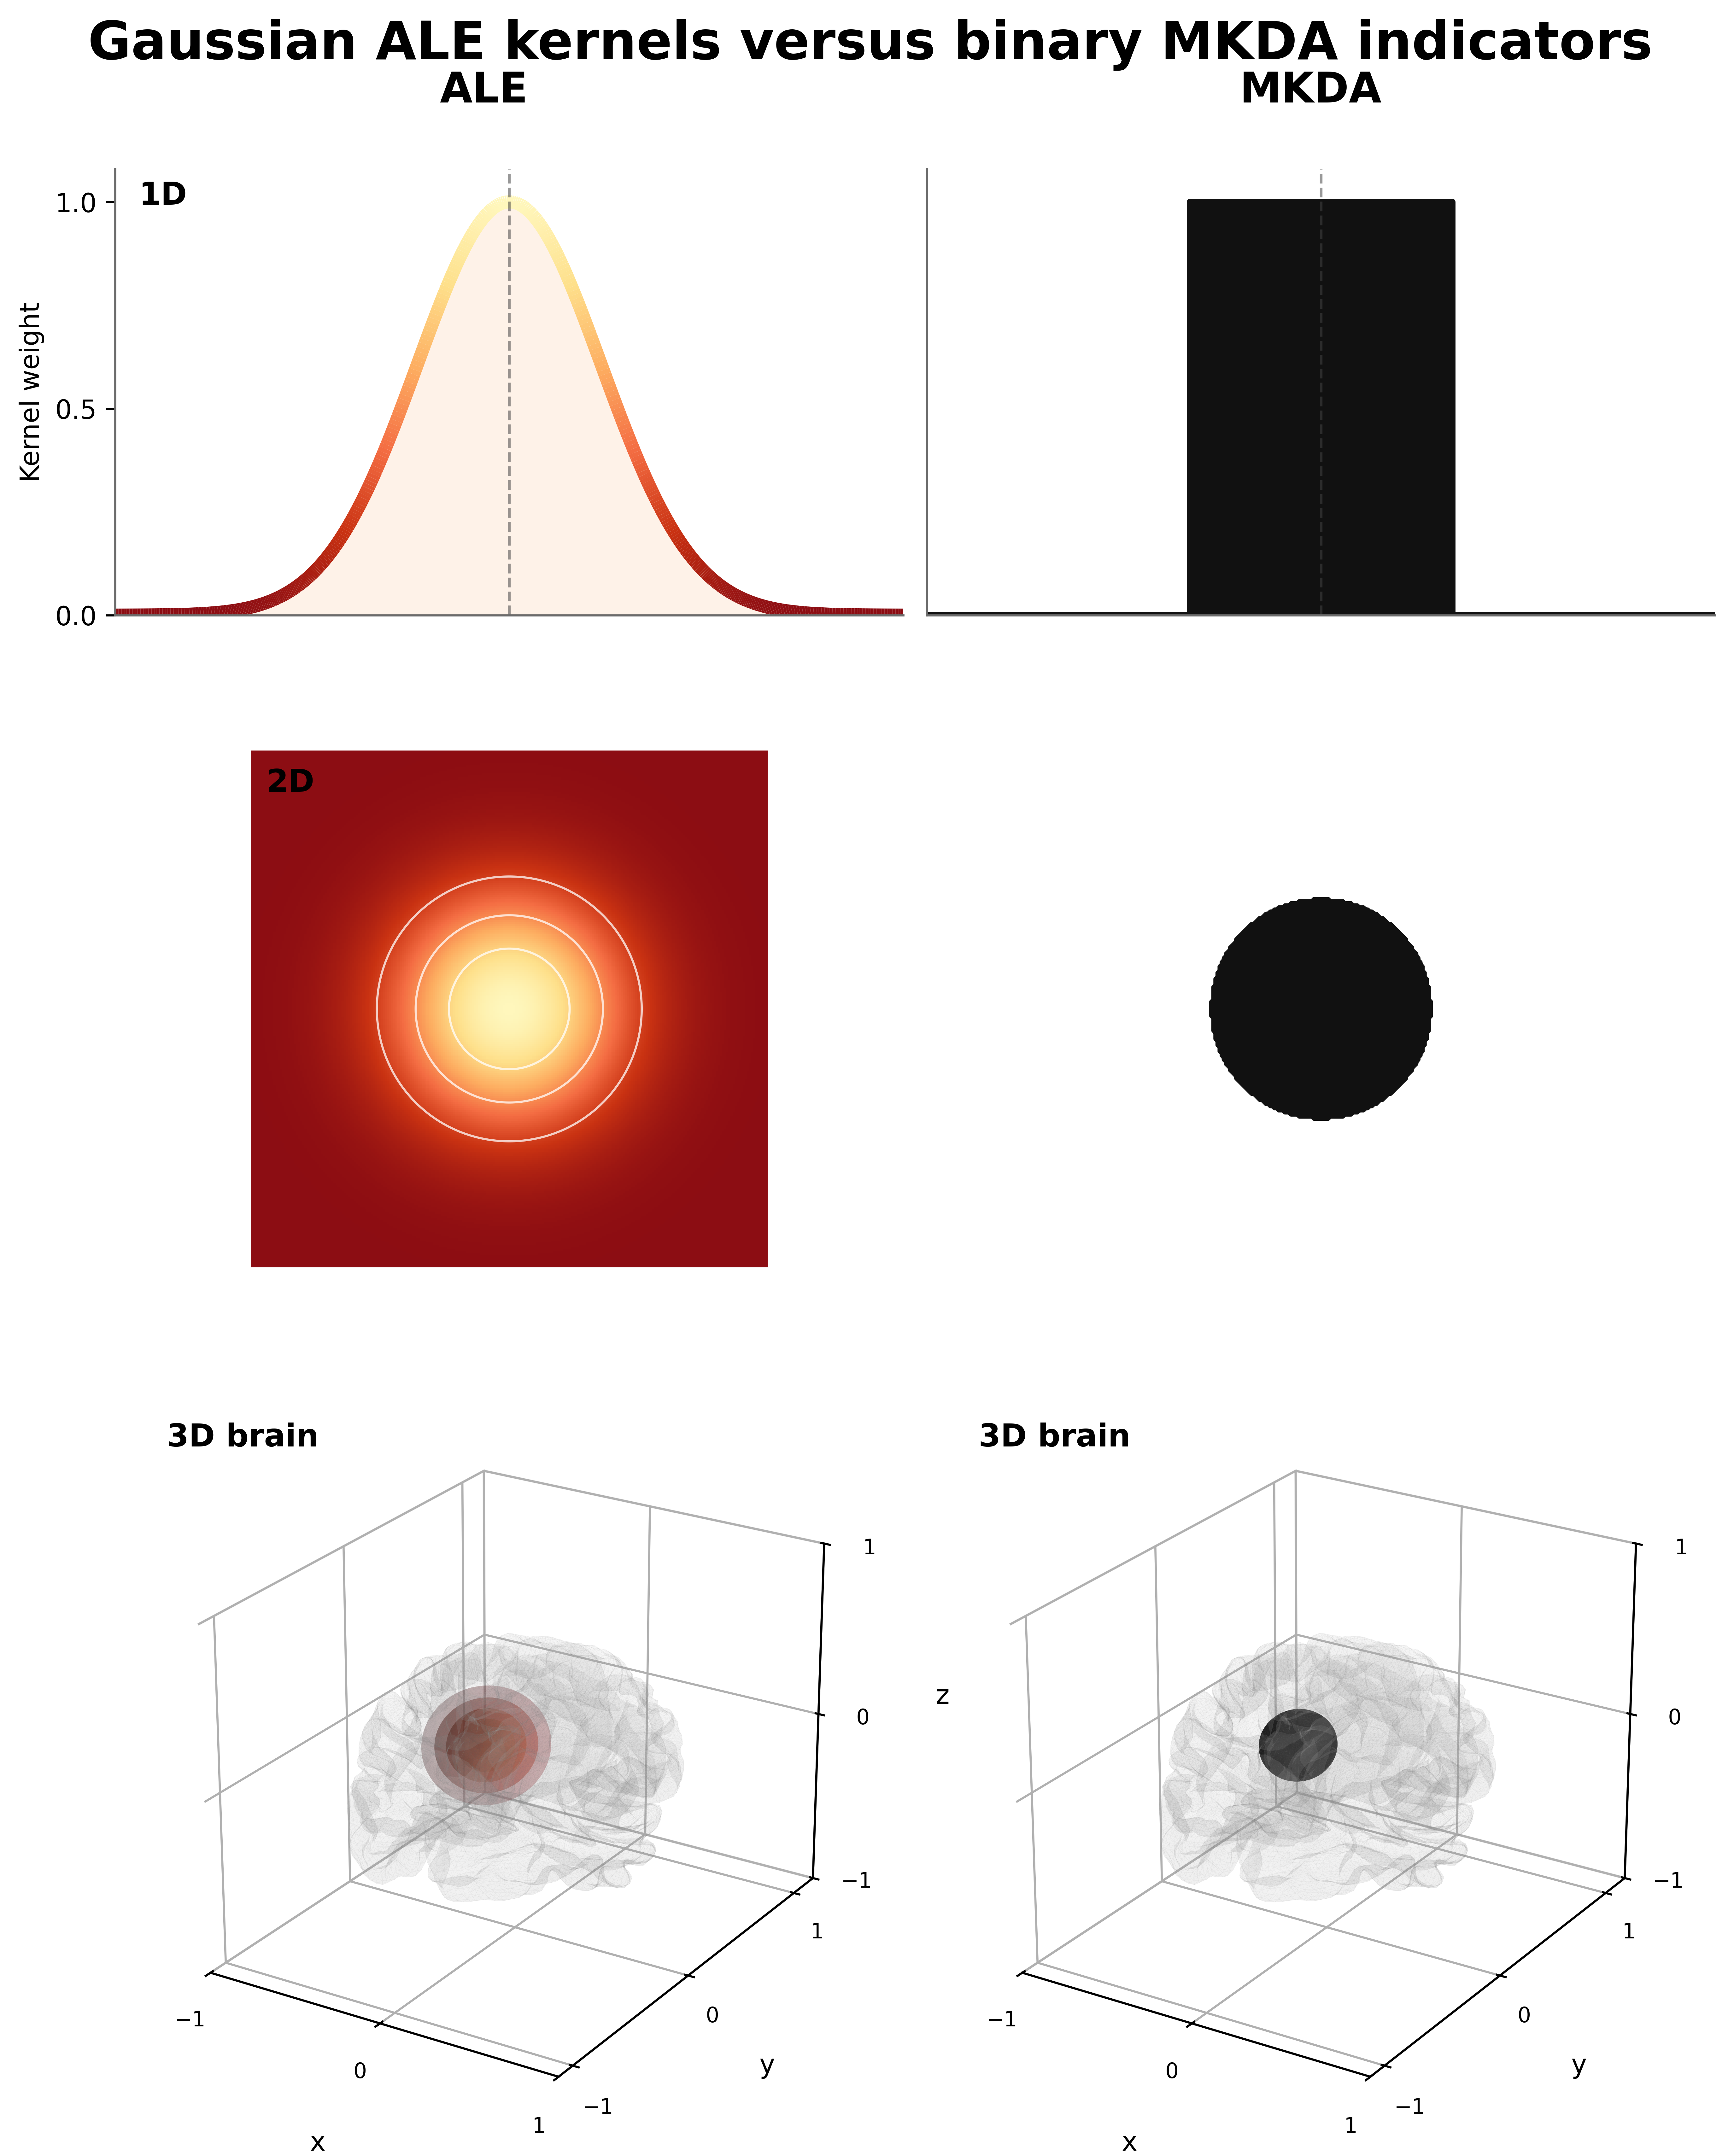
ALE models the spatial uncertainty of reported coordinates using a Gaussian kernel, while MKDA uses a binary indicator of whether a voxel is within a specified radius of a reported coordinate. This means that ALE provides a probabilistic map of activation likelihood, while MKDA provides a more direct count (or proportion) of how many studies report a coordinate near each voxel. Okay, so between studies we sum up the overlapping kernel values, but what if we have kernels that overlap within the same study? When you have multiple coordinates from the same study that are close enough together such that the kernels overlap; you have options on how you can combine them. you could add the overlapping values together, take a mean, or take a maximum. For ALE, we chose maximum, which is the accepted standard in the field. And for MKDA, you could say we also chose maximum, but since the kernel is binary, the maximum is equivalent to a logical OR across coordinates from the same study.
The Advantages of MKDA
The binary kernel gives several advantages to MKDA:
- The output is more interpretable, as it directly reflects the proportion of studies that report activation near a given voxel, rather than a probability density that can be harder to interpret.
- The contribution of each study to a particular voxel is strictly binary, so a single study cannot dominate the results by reporting multiple nearby coordinates. ALE mitigates this by taking the maximum across overlapping kernels, but the probability mass in that area is still more concentrated than if there were only a single coordinate.
- MKDA is more computationally efficient, as it does not require estimating a probability density function, while still maintaining a high level of sensitivity to consistent activation across studies (equivalent or better than ALE in simulations, forthcoming).
This isn't a hit piece on ALE, which does have its strengths for precise spatial localization. You can check for yourself whether that difference is meaningful in practice.
Pairwise Comparisons and Subtraction Analyses
Here's the rub. ALESubtraction feels more intuitive, because you're taking one group's probability density map and subtracting another's, then thresholding the result to find areas where one group shows greater activation likelihood than the other.
MKDAChi2 looks less familiar on the surface, but the underlying logic is straightforward.
The main question being tested is whether a voxel shows a higher proportion of studies reporting activation in one group versus another.
For example:
- 9/10 studies report a coordinate within 6mm of this voxel in group A
- 2/10 studies report a coordinate within 6mm of this voxel in group B
A chi-square test then evaluates whether that difference is statistically significant.
What I just described is the association test output (as opposed to uniformity, which tests whether the proportion of studies reporting activation at a voxel is higher than expected by chance).
MKDAChi2 is the algorithm that was used to generate the thousands of maps in neurosynth.org, where studies were split based on whether they contained a given term in the title/abstract.
However, MKDAChi2 is much more flexible than that—you can compare any two groups of studies (including the entire database vs a subset).
Why would you do this?
I just ran 1200 MKDAChi2 analyses on simulated data—it took about 2 minutes.
Guess how long it took to run 1200 ALESubtraction analyses on the same data?
Over 6 hours!
MKDAChi2 is over 180× faster, and you still get a statistically rigorous comparison.
More compute does not always mean better results—so if you want to compare two groups of studies, try MKDAChi2.
Alternatively, if you think you can make ALESubtraction run faster
and be more memory efficient, please help.
Further Reading
ALE (Activation Likelihood Estimation)
Turkeltaub et al. (2002) – Original ALE paper
https://doi.org/10.1006/nimg.2002.1139Eickhoff et al. (2009) – Random-effects ALE formulation
https://doi.org/10.1002/hbm.20718Eickhoff et al. (2012) – Updated ALE methods and corrections
http://dx.doi.org/10.1016/j.neuroimage.2011.09.017
MKDA (Multilevel Kernel Density Analysis)
Wager et al. (2007) – Foundational MKDA framework
https://doi.org/10.1093/scan/nsm015Kober et al. (2008) – MKDA applied to emotion studies
https://doi.org/10.1016/j.neuroimage.2008.03.059
Comparative Work
- Salimi-Khorshidi et al. (2009) – Comparison of CBMA methods (ALE, MKDA, etc.)
https://doi.org/10.1016/j.neuroimage.2008.12.039